
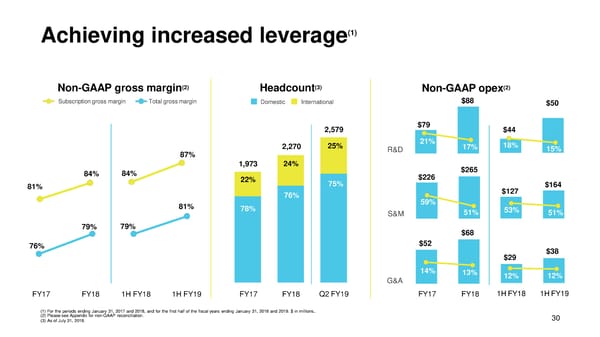
(1) Achieving increased leverage (2) Headcount(3) (2) Non-GAAP grossmargin Non-GAAPopex Subscriptiongross margin Total grossmargin Domestic International $88 $50 2,579 $79 $44 2,270 25% 21% 17% 18% 15% 87% R&D 1,973 24% $265 84% 84% 22% $226 81% 75% $127 $164 76% 59% 81% 78% S&M 51% 53% 51% 79% 79% $68 76% $52 $29 $38 14% 13% 12% 12% G&A FY17 FY18 1HFY18 1HFY19 FY17 FY18 Q2FY19 FY17 FY18 1HFY18 1HFY19 (1) For the periods ending January 31, 2017 and 2018, and for the first half of the fiscal years ending January 31, 2018 and 2019. $ in millions.. (2) Please see Appendix for non-GAAP reconciliation. (3) As of July 31, 2018. 30
 DocuSign Presentation Page 30 Page 32