
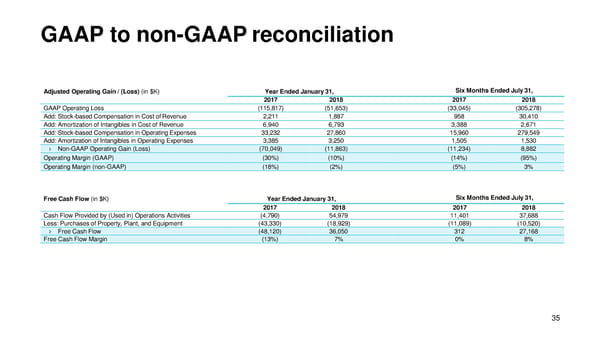
GAAP to non-GAAPreconciliation Adjusted Operating Gain / (Loss) (in $K) Year Ended January31, Six Months Ended July31, 2017 2018 2017 2018 GAAP Operating Loss (115,817) (51,653) (33,045) (305,278) Add: Stock-based Compensation in Cost ofRevenue 2,211 1,887 958 30,410 Add: Amortization of Intangibles in Cost of Revenue 6,940 6,793 3,388 2,671 Add: Stock-based Compensation in OperatingExpenses 33,232 27,860 15,960 279,549 Add: Amortization of Intangibles in Operating Expenses 3,385 3,250 1,505 1,530 Non-GAAP Operating Gain (Loss) (70,049) (11,863) (11,234) 8,882 Operating Margin (GAAP) (30%) (10%) (14%) (95%) Operating Margin (non-GAAP) (18%) (2%) (5%) 3% Free Cash Flow (in $K) Year Ended January31, Six Months Ended July31, 2017 2018 2017 2018 Cash Flow Provided by (Used in) Operations Activities (4,790) 54,979 11,401 37,688 Less: Purchases of Property, Plant, and Equipment (43,330) (18,929) (11,089) (10,520) Free CashFlow (48,120) 36,050 312 27,168 Free Cash Flow Margin (13%) 7% 0% 8% 35
 DocuSign Presentation Page 35 Page 37