
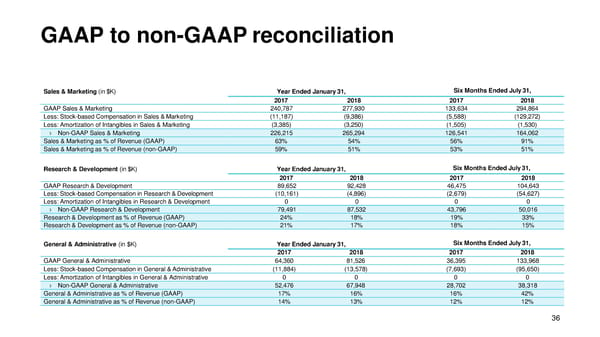
GAAP to non-GAAPreconciliation Sales & Marketing (in$K) Year Ended January31, Six Months Ended July31, 2017 2018 2017 2018 GAAP Sales & Marketing 240,787 277,930 133,634 294,864 Less: Stock-based Compensation in Sales &Marketing (11,187) (9,386) (5,588) (129,272) Less: Amortization of Intangibles in Sales & Marketing (3,385) (3,250) (1,505) (1,530) Non-GAAP Sales & Marketing 226,215 265,294 126,541 164,062 Sales & Marketing as % of Revenue (GAAP) 63% 54% 56% 91% Sales & Marketing as % of Revenue (non-GAAP) 59% 51% 53% 51% Research & Development (in$K) Year Ended January31, Six Months Ended July31, 2017 2018 2017 2018 GAAP Research &Development 89,652 92,428 46,475 104,643 Less: Stock-based Compensation in Research &Development (10,161) (4,896) (2,679) (54,627) Less: Amortization of Intangibles in Research & Development 0 0 0 0 Non-GAAP Research &Development 79,491 87,532 43,796 50,016 Research & Development as % of Revenue(GAAP) 24% 18% 19% 33% Research & Development as % of Revenue (non-GAAP) 21% 17% 18% 15% General & Administrative (in $K) Year Ended January31, Six Months Ended July31, 2017 2018 2017 2018 GAAP General &Administrative 64,360 81,526 36,395 133,968 Less: Stock-based Compensation in General &Administrative (11,884) (13,578) (7,693) (95,650) Less: Amortization of Intangibles in General & Administrative 0 0 0 0 Non-GAAP General &Administrative 52,476 67,948 28,702 38,318 General & Administrative as % of Revenue (GAAP) 17% 16% 16% 42% General & Administrative as % of Revenue (non-GAAP) 14% 13% 12% 12% 36
 DocuSign Presentation Page 36 Page 38