
DocuSign Presentation
Transforming the foundation of doing business - Investor Presentation
Transforming the foundation of doing business
This is a modal window.
Safe Harbor This presentation has been prepared by DocuSign, Inc. (“DocuSign”) for informational purposes only and not for any other purpose. Nothing contained in this presentation is, or should be construed as, a recommendation, promise or representation by the presenter or DocuSign or any officer, director, employee, agent or advisor of DocuSign. This presentation does not purport to be all-inclusive or to contain all of the information you may desire. Information provided in this presentation speaks only as of the date hereof. DocuSign assumes no obligation to update any information or statement after the date of this presentation as a result of new information, subsequent events, or any othercircumstances. This presentation includes express and implied “forward-looking statements” within the meaning of the Private Securities Litigation Reform Act of 1995. In some cases, you can identify forward-looking statements by terms such as “anticipate,” “believe,” “estimate,” “expect,” “intend,” “may,” “might,” “plan,” “project,” “will,” “would,” “should,” “could,” “can,” “predict,” “potential,” “continue,” or the negative of these terms, and similar expressions intended to identify forward-looking statements. However, not all forward-looking statements contain these identifying words. These statements may relate to our estimated preliminary financial results and other key business metrics for the quarter ended October 31, 2018 and the year ended January 31, 2019, strategic plans or objectives, revenues or earnings projections, or other financial items. By their nature, these statements are subject to numerous uncertainties, including factors beyond our control, that could cause actual results, performance or achievement to differ materially and adversely from those anticipated or implied in the statements. You should not rely upon forward-looking statements as predictions of future events. Although our management believes that the expectations reflected in our statements are reasonable, we cannot guarantee that the future results, levels of activity, performance or events and circumstances described in the forward-looking statements will be achieved or occur. Moreover, neither we, nor any other person, assumes responsibility for the accuracy and completeness of these statements. Recipients are cautioned not to place undue reliance on these forward- looking statements, which speak only as of the date such statements are made and should not be construed as statements of fact. Except to the extent required by federal securities laws, we undertake no obligation to update these forward-looking statements to reflect events or circumstancesafter the date hereof, or to reflect the occurrenceof unanticipatedevents. Forward-lookingstatementsare based on informationavailableat the time those statementsare made or management’sgood faith beliefsand assumptionsas of that time with respectto future events,and are subject to risks and uncertaintiesthat could cause actual performanceor results to differ materiallyfrom those expressed in, or suggested by, the forward-looking statements.In light of these risks and uncertainties,the events and circumstances contemplated by the forward- looking statements made in this presentation may not occur and actual results could differ materially from those anticipated or implied in the forward-looking statements. These risks and uncertainties are described in greater detail under the heading “Risk Factors” in our prospectus filed pursuant to Rule 424(b) under the Securities Act of 1933, as amended, on April 26, 2018 and in our quarterly report on Form 10-Q that we will file with the Securities and Exchange Commission (the “SEC”) on September 6, 2018, and include, but are not limited to, our ability to retain and upgrade paying users; our ability to attract new users or convert registered users to paying users; our future financial performance, including our ability to effectively sustain and manage our growth and future expenses, and our ability to achieve and maintain future profitability; our ability to attract new customers and to maintain and expand our existing customer base; our ability to scale and update our platform to respond to customers’ needs and rapid technological change; the effects of increased competition on our market and our ability to compete effectively; our ability to expand our operations and increase adoption of our platform internationally; our ability to maintain, protect and enhance our brand; the sufficiency of our cash and cash equivalents to satisfy our liquidity needs; our failure or the failure of our platform of services to comply with applicable industry standards, laws, and regulations; our ability to attract large organizations as users; our ability to maintain our corporate culture; our ability to offer high-quality customer support; our ability to hire, retain and motivate qualified personnel; our ability to identify targets for, execute on and realize the benefits of potential acquisitions; our ability to estimate the size and potential growth of our target market; and our ability to maintain proper and effective internal controls. These factors could cause actual results, performance or achievement to differ materially and adversely from those anticipated or implied in the forward-looking statements. Additional information will be made available in other future reports that we may file with the SEC from time to time, which could cause actual results to vary from expectations. Except as required by law, we do not undertakeany obligationto publiclyupdate or revise any forward-lookingstatement,whetheras a result of new information,future developmentsor otherwise. This presentation also contains estimates and other statistical data made by independent parties and by us relating to market size and growth and other data about our industry. This data involves a number of assumptions and limitations, and you are cautioned not to give undue weight to such estimates. In addition, projections, assumptions, and estimates of our future performance and the future performance of the marketsin whichwe operateare necessarilysubjectto a highdegree of uncertaintyand risk. Our long-term target results are the view of management.Wecan provideno assurancesthat any of the revenuegrowth, grossmargin,operatingmarginor cashflowtargetswill be achievedin a periodof time that is material,if at all. 2
Use of Non-GAAPMeasures In addition to the financials presented in accordance with U.S. generally accepted accounting principles (“GAAP”), this presentation includes certain non-GAAP financial measures. We use the following non-GAAP financial informationto evaluateour ongoing operations and for internal planning and forecastingpurposes:non-GAAP gross profit, non-GAAP gross margin, free cash flow, free cash flow margin, and dollar-basednet retention rate. We believe that non- GAAP financial information, when taken collectively, may be helpful to investors because it provides consistency and comparability with past financial performance. However, non- GAAPfinancialinformationis presentedfor supplementalinformationalpurposesonly,has limitationsas an analytical tool and should not be consideredin isolationor as a substitutefor financialinformationpresented in accordance with GAAP. In particular, free cash flow is not a substitute for cash used in operating activities. Additionally, the utility of free cash flow as a measure of our financial performance and liquidity is further limited as it does not represent the total increase or decrease in our cash balance for a given period. In addition, other companies, including companies in our industry, may calculate similarly-titled non- GAAP measures differently or may use other measures to evaluate their performance, all of which could reduce the usefulness of our non-GAAP financial measures as tools for comparison. We urge you to review the reconciliation of our non-GAAP financial measures to the most directly comparable GAAP financial measures set forth in the Appendix, and not to rely on any single financial measure to evaluate our business. This presentation also contains certain estimated preliminary financial results and other key business metrics for the quarter ended October 31, 2018 ended January 31, 2019. This data is based on information available to us at this time. As such, our actual results may vary from the estimated preliminary results presented in this presentation. These estimates should not be viewed as a substitute for our full interim or annual financial statements prepared in accordance with GAAP. Accordingly, you should not place undue reliance on this preliminary data. In addition, this data has been prepared by, and is the responsibility of, management. Our independent registered public accounting firm, PricewaterhouseCoopers LLP, has not audited, reviewed, compiled, or performed any procedures with respect to the preliminary financial results. Accordingly, PricewaterhouseCoopers LLP does not express an opinion or any other form of assurance with respect thereto. 3


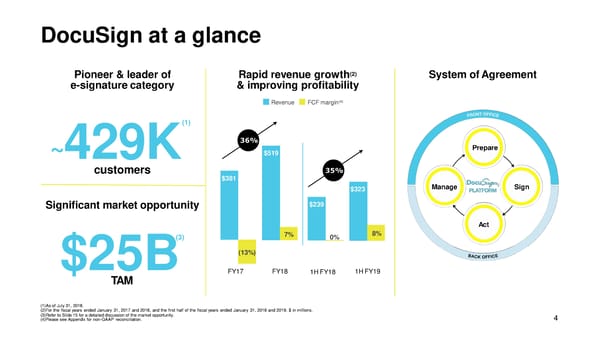
DocuSign at a glance Pioneer & leader of Rapid revenue growth(2) System ofAgreement e-signaturecategory & improving profitability Revenue FCFmargin(4) (1) 36% ~429K $519 Prepare customers 35% $381 $323 Manage Sign Significant market opportunity $239 Act (3) 7% 0% 8% $25B (13%) TAM FY17 FY18 1HFY18 1HFY19 (1)As of July 31, 2018. (2)For the fiscal years ended January 31, 2017 and 2018, and the first half of the fiscal years ended January 31, 2018 and 2019. $ in millions. (3)Refer to Slide 15 for a detailed discussion of the market opportunity. (4)Please see Appendix for non-GAAP reconciliation. 4
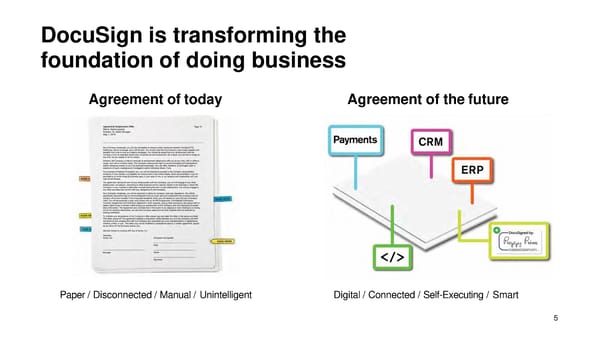
DocuSign is transforming the foundation of doing business Agreement oftoday Agreement of thefuture Paper / Disconnected / Manual / Unintelligent Digital / Connected / Self-Executing / Smart 5
Business runs on agreements and they are everywhere Sales Marketing Services Human Finance Sales Order Processing Event Registration Account Change Resources Invoice Processing Customer Account Customer Communication Service/WorkOrders OfferLetters Expense Processing Provisioning Approvals TermsChange New Hire Paperwork Capitalization Management Special Deal Terms Mass Mailing/Email Approval Self-Service Requests Candidate NDA Audit Sign-off Referral Agreements Event Vendor Agreements Compliance On/Off-boardingChecklist Policy Management Reseller Agreements Rebate Agreements Field Service Employee Policy Distribution InventorySign-off Partner Agreements Sponsorship Agreements New Policy Applications &Signature Asset Transfer/Retirement Sales Support Promotion Agreements Policy Cancellations/ ContractorAgreements GrantApplications Loan Documents Advertising Contracts Suspensions Non-disclosure Sales and Use TaxReturn SupportAgreements Press Release Approvals Independent Agency Licensing PTOManagement Consumer AccountOpening andRenewals Brand Licensing Agreements EFT Authorization PerformanceAppraisal Deposit Products Media Plan Sign-offs BackgroundChecks IT/Operations Legal Facilities Product Procurement Asset Tracking NDAs Invoice Processing Management Purchase Order Change Requests ContractManagement Expense Processing Change Management Statement ofWork RequirementsSign-off Internal Compliance Capitalization Management Release Management Master Services Agreement Access Management IP Licensing Audit Sign-off Code Review Reporting RFP Sign-off Incident Reporting Patent Applications Policy Management RequirementsAcceptance Supplier Compliance Production Change BoardMinutes InventorySign-off Release Scope Commitment Service Level Agreements Authorization Affidavits Asset Transfer/Retirement Policy Approval TerminationLetters Maintenance Authorization Summons GrantApplications Beta/SDK Agreements Software License Agreements Authorization EngagementLetters Sales and Use TaxReturn Developer ProgramEnrollment RateCards Real EstateApproval Memoranda ofUnderstanding Consumer AccountOpening Product Development Methods Invoice Processing Project BudgetApprovals Deposit Products New ProductEvaluation SubcontractorAgreements New OfferingAnnouncement Vendor Contracts 6
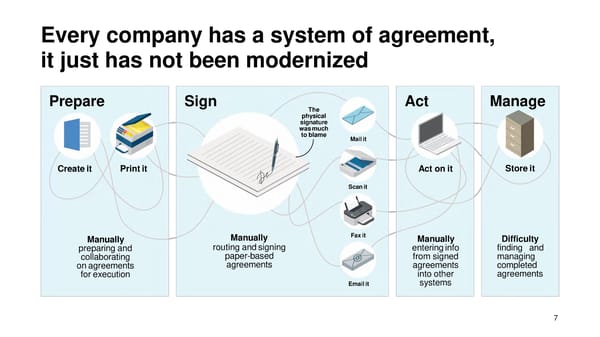
Every company has a system of agreement, it just has not been modernized Prepare Sign The Act Manage physical signature wasmuch toblame Mailit Createit Printit Act onit Storeit Scanit Manually Manually Faxit Manually Difficulty preparing and routing andsigning enteringinfo finding and collaborating paper-based from signed managing onagreements agreements agreements completed for execution into other agreements Emailit systems 7
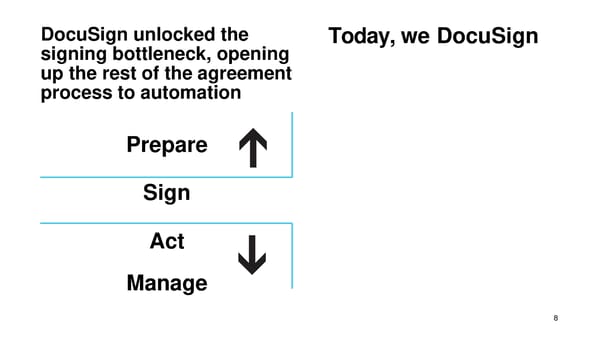
DocuSign unlocked the Today, we DocuSign signing bottleneck, opening up the rest of the agreement process to automation Prepare Sign Act Manage 8
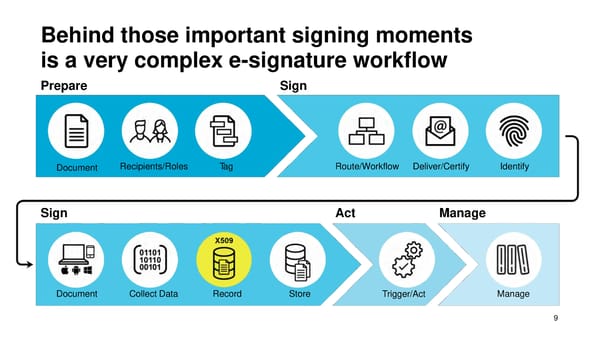
Behind those important signing moments is a very complex e-signature workflow Prepare Sign Document Recipients/Roles Tag Route/Workflow Deliver/Certify Identify Sign Act Manage Document Collect Data Record Store Trigger/Act Manage 9
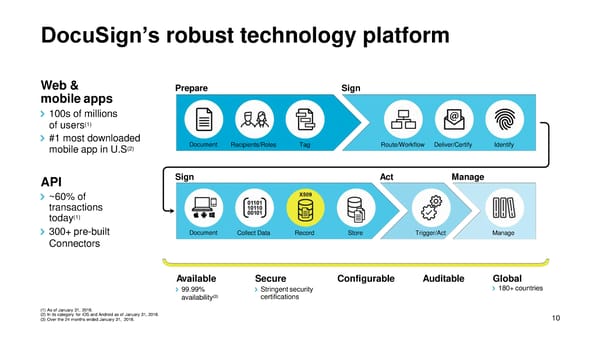
DocuSign’s robust technology platform Web & Prepare Sign mobileapps 100s of millions of users(1) #1 most downloaded Document Recipients/Roles Tag Route/Workflow Deliver/Certify Identify mobile app in U.S(2) API Sign Act Manage ~60% of transactions (1) today 300+pre-built Document Collect Data Record Store Trigger/Act Manage Connectors Available Secure Configurable Auditable Global 99.99% Stringentsecurity 180+countries (3) certifications availability (1) As of January 31, 2018. (2) In its category for iOS and Android as of January 31, 2018. (3) Over the 24 months ended January 31, 2018. 10
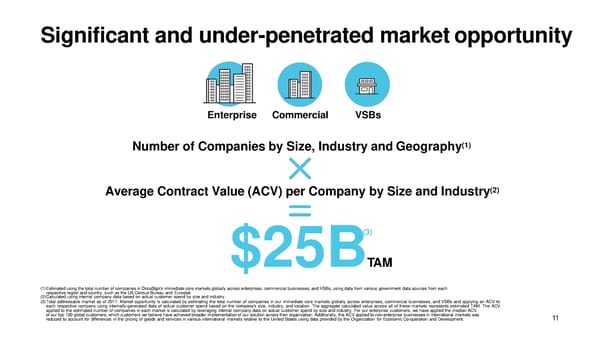
Significant and under-penetrated marketopportunity Enterprise Commercial VSBs (1) Number of Companies by Size, Industry andGeography (2) Average Contract Value (ACV) per Company by Size and Industry (3) $25BTAM (1)Estimated using the total number of companies in DocuSign’s immediate core markets globally across enterprises, commercial businesses, and VSBs, using data from various government data sources from each respective region and country, such as the US Census Bureau and Eurostat. (2)Calculated using internal company data based on actual customer spend by size and industry. (3)Total addressable market as of 2017. Market opportunity is calculated by estimating the total number of companies in our immediate core markets globally across enterprises, commercial businesses, and VSBs and applying an ACV to each respective company using internally-generated data of actual customer spend based on the company’s size, industry, and location. The aggregate calculated value across all of these markets represents estimated TAM. The ACV applied to the estimated number of companies in each market is calculated by leveraging internal company data on actual customer spend by size and industry. For our enterprise customers, we have applied the median ACV of our top 100 global customers, which customers we believe have achieved broader implementation of our solution across their organization. Additionally, the ACV applied to non-enterprise businesses in international markets was reduced to account for differences in the pricing of goods and services in various international markets relative to the United States using data provided by the Organization for Economic Co-operation and Development. 11
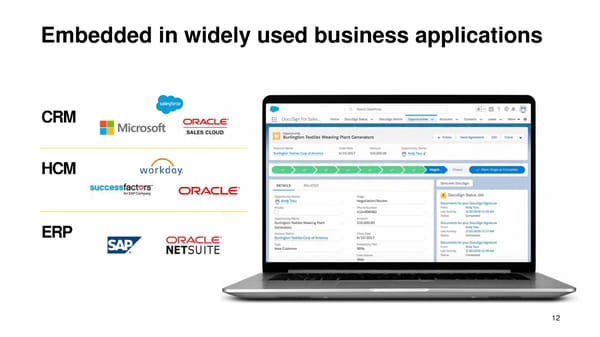
Embedded in widely used business applications CRM HCM ERP 12
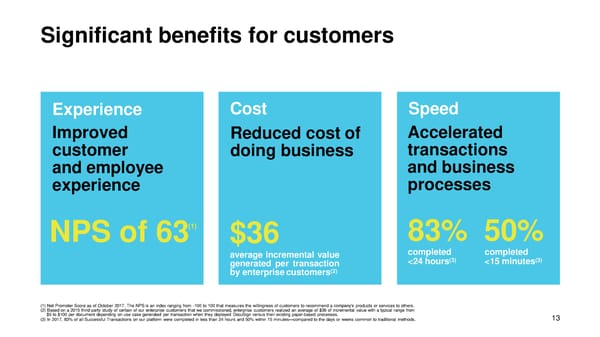
Significant benefits for customers Experience Cost Speed Improved Reduced costof Accelerated customer doingbusiness transactions andemployee andbusiness experience processes (1) 83% 50% NPSof63 $36 average incremental value completed completed (3) (3) generated per transaction <24hours <15minutes byenterprisecustomers(2) (1) Net Promoter Score as of October 2017. The NPSis an index ranging from -100 to 100 that measures the willingness of customers to recommend a company’s products or services to others. (2) Based on a 2015 third-party study of certain of our enterprise customers that we commissioned, enterprise customers realized an average of $36 of incremental value with a typical range from $5 to $100 per document depending on use case generated per transaction when they deployed DocuSign versus their existing paper-based processes. (3) In 2017, 83% of all Successful Transactions on our platform were completed in less than 24 hours and 50% within 15 minutes—compared to the days or weeks common to traditional methods. 13
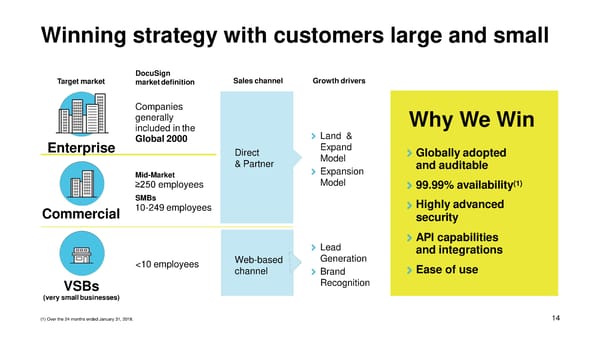
Winning strategy with customers large and small DocuSign Saleschannel Growthdrivers Targetmarket marketdefinition Companies generally Why WeWin included inthe Land & Enterprise Global2000 Expand Direct Model Globallyadopted &Partner Expansion andauditable Mid-Market Model ≥250employees (1) 99.99%availability SMBs Highlyadvanced Commercial 10-249employees security Lead API capabilities Web-based Generation andintegrations <10employees channel Brand Ease of use VSBs Recognition (very smallbusinesses) (1) Over the 24 months ended January 31, 2018. 14
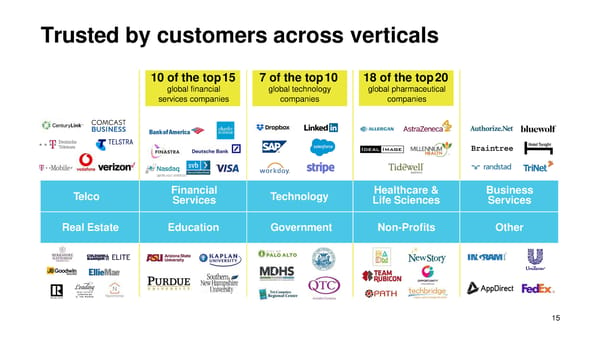
Trusted by customers across verticals 10 of the top15 7 of the top10 18 of the top20 global financial global technology global pharmaceutical services companies companies companies Telco Financial Technology Healthcare & Business Services Life Sciences Services RealEstate Education Government Non-Profits Other 15
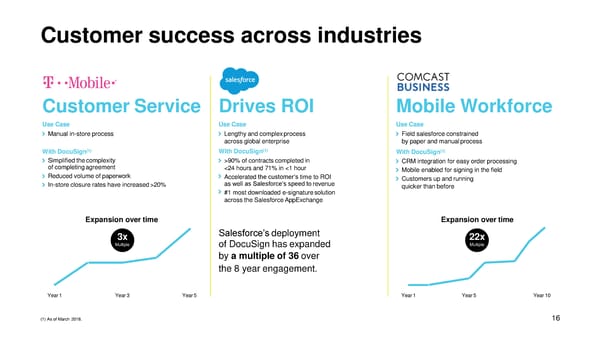
Customer success across industries CustomerService DrivesROI MobileWorkforce UseCase UseCase UseCase Manual in-store process Lengthy and complexprocess Field salesforce constrained across global enterprise by paper and manualprocess With DocuSign(1) With DocuSign(1) With DocuSign(1) Simplified thecomplexity >90% of contracts completedin CRM integration for easy order processing of completingagreement <24 hours and 71% in <1 hour Mobile enabled for signing in the field Reduced volume ofpaperwork Accelerated the customer’s time to ROI Customers up andrunning In-store closure rates have increased>20% as well as Salesforce’s speed torevenue quicker thanbefore #1 most downloaded e-signaturesolution across the SalesforceAppExchange Expansion overtime Expansion overtime 3x Salesforce’sdeployment 22x Multiple of DocuSign hasexpanded Multiple by a multiple of 36 over the 8 year engagement. Year1 Year3 Year5 Year1 Year5 Year10 (1) As of March 2018. 16
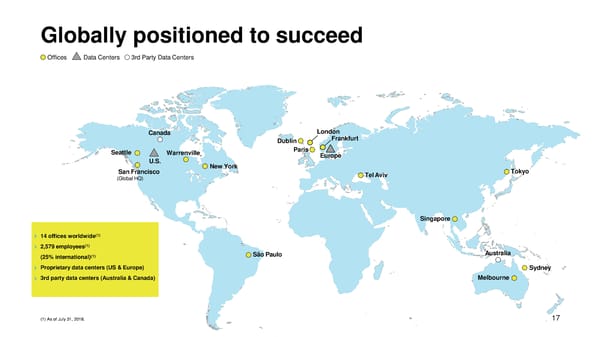
Globally positioned to succeed Offices Data Centers 3rd Party Data Centers Canada London Dublin Frankfurt Seattle Warrenville Paris Europe U.S. NewYork SanFrancisco TelAviv Tokyo (Global HQ) Singapore (1) 14 offices worldwide 2,579employees(1) (25%international)(1) SãoPaulo Australia Proprietary data centers (US &Europe) Sydney 3rd party data centers (Australia &Canada) Melbourne (1) As of July 31, 2018. 17
This is a modal window.
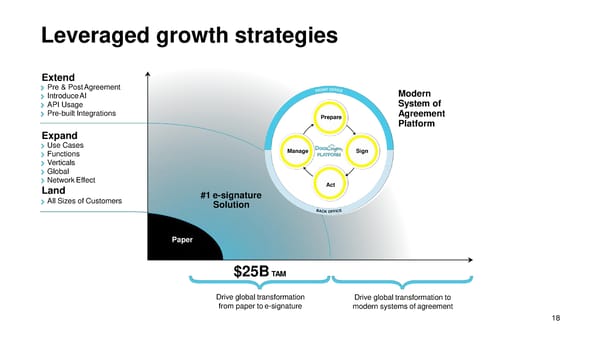
Leveraged growthstrategies Extend Pre & PostAgreement Modern IntroduceAI System of APIUsage Pre-built Integrations Prepare Agreement Platform Expand UseCases Manage Sign Functions Verticals Global NetworkEffect Act Land #1e-signature All Sizes of Customers Solution Paper $25BTAM Drive global transformation Drive global transformation to from paper toe-signature modern systems ofagreement 18
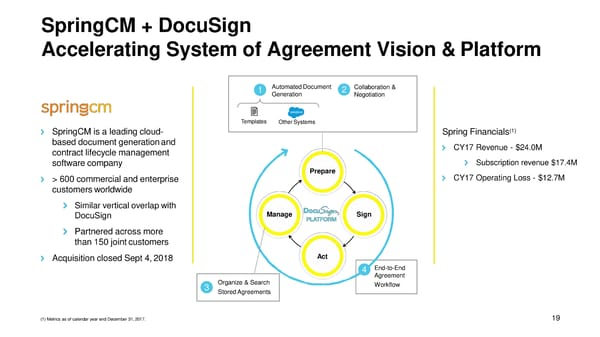
SpringCM +DocuSign Accelerating System of Agreement Vision &Platform 1 AutomatedDocument 2 Collaboration & Generation Negotiation Templates OtherSystems SpringCM is a leading cloud- Spring Financials(1) based document generationand CY17 Revenue - $24.0M contract lifecycle management softwarecompany Subscription revenue $17.4M > 600 commercial and enterprise Prepare CY17 Operating Loss - $12.7M customersworldwide Similar vertical overlap with DocuSign Manage Sign Partnered across more than 150 jointcustomers Acquisition closed Sept 4,2018 Act 4 End-to-End Agreement 3 Organize & Search Workflow StoredAgreements (1) Metrics as of calendar year end December 31,2017. 19
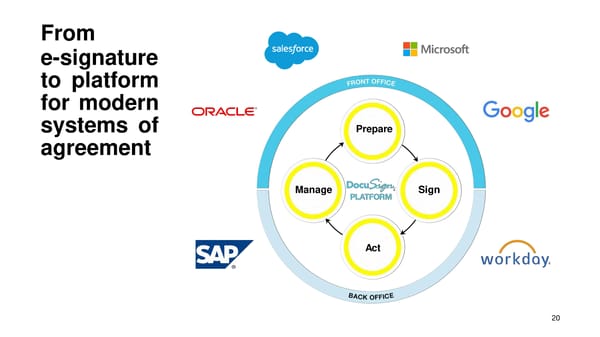
From e-signature to platform for modern systems of Prepare agreement Manage Sign Act 20
Financial Review 21
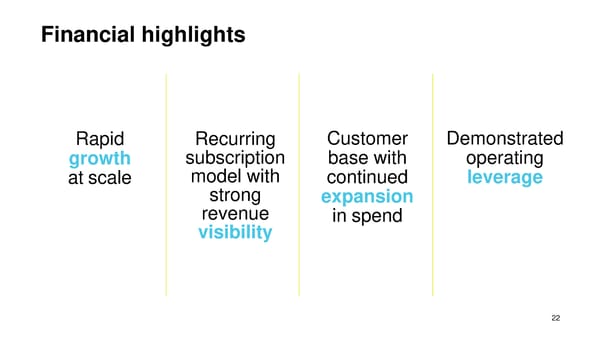
Financial highlights Rapid Recurring Customer Demonstrated growth subscription base with operating at scale model with continued leverage strong expansion revenue in spend visibility 22
Strong growth across the board(1) Billings(2) Revenue Billings(2) Revenue Enterprise &commercial Enterprise &commercial Web &mobile Web &mobile 39% $599 36% $519 $432 14% $381 33% 35% $323 15% $341 15% $257 $239 15% 86% 85% 85% 85% FY17 FY18 FY17 FY18 1HFY18 IH FY19 1HFY18 1HFY19 (1) For the fiscal years ended January 31, 2017 and 2018, and for the first half of the fiscal years ended January 31, 2018 and 2019. $ in millions. (2) Billings defined as total revenues plus the change in contract liabilities and refund liability less contract assets and unbilled accounts receivable in a given period. Please see Appendix for non-GAAP reconciliation. 23
Capacity-based subscription model Pricing by functionality & Envelopes(1) Wide range of customers & deal sizes # ofEnvelopes Product editions provisioned Single-user Multi-user Business Enterprise Platform Pro Pro Enterprise Basic Business Payments Advanced All products e-signature fields Automation admin functionality APIaccess Industry Advanced CRM modules workflows connectors Commercial & # of Envelopes provisioned VSBs Single- Multi- Business Enterprise Platform user user Pro Pro (1) An Envelope is a digital container used to send one or more documents for signature or approval to one or more recipients. 24
Strong revenuevisibility (1) (2) Revenuecontribution Average contract length Subscription Professional services &other ≤12months >12months 9% 7% 6% 5% Bycontracts Dollar weighted 13% 37% 91% 93% 94% 95% 13 19 months months 87% 63% FY17 FY18 1HFY18 1HFY19 (1) For the fiscal years ended January 31, 2017 and 2018, and for the first half of the fiscal years ended January 31, 2018 and 2019. (2) First half of the fiscal year ended January 31, 2019. 25
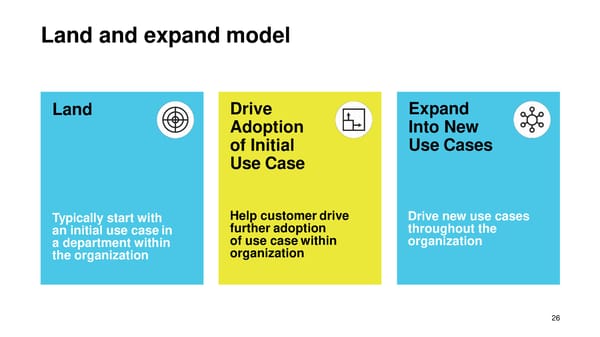
Land and expandmodel Land Drive Expand Adoption Into New of Initial UseCases UseCase Typically start with Help customerdrive Drive new use cases an initial use casein further adoption throughout the a department within of use casewithin organization the organization organization 26
Large and growing customerbase (1) Enterprise &commercial Totalcustomers (2) customers ~429K 49K 373K 42K 289K 47% 60% 30K CAGR CAGR 214K 23K 147K 18K 96K 12K 54K 4K FY13 FY14 FY15 FY16 FY17 FY18 Q2FY19 FY13 FY14 FY15 FY16 FY17 FY18 Q2FY19 (1) At period end. (2) Comprised of customers who were not acquired through our self-service channel. 27
Demonstrated expansion within cohorts Cohortanalysis Customers with >$300K inACV(3) 5.2x 115% 246 Top 100 Customers Net Retention Life-to-Date Rate as of July31, Purchase Multiple as (2) 2018 of July 31, 2018(1) ~8x 30 FY13 FY14 FY15 FY16 FY17 FY18 FY13 Q2FY19 (1) For our top 100 customers as measured by ACVfor the quarter ended July 31, 2018 that placed their first order in, or prior to, the fiscal year ended January 31, 2014. (2) Compares the ACV for subscription contracts from a set of enterprise and commercial customers at two period end dates. To calculate our dollar-based net retention rate at the end of a base year (e.g., January 31, 2017), we first identify the set of customers that were customers at the end of the prior year (e.g., January 31, 2016) and then divide the ACV attributed to that set of customers at the end of the base year by the ACV attributed to that same set at the end of the prior year. The quotient obtained from this calculation is the dollar-based net retention rate. (3)Average Contract Value. 28
Rapid international expansion (1) Global growthinvestments Revenue bygeography International e-signature 17% Products eHanko Standards-Based Signatures (SBS) SAP Deutsche Partnerships Ingram Telekom Telstra Brazil UK France Presence Singapore Australia Germany Domestic Japan 83% (1) For the six months ended July 31, 2018. 29
(1) Achieving increased leverage (2) Headcount(3) (2) Non-GAAP grossmargin Non-GAAPopex Subscriptiongross margin Total grossmargin Domestic International $88 $50 2,579 $79 $44 2,270 25% 21% 17% 18% 15% 87% R&D 1,973 24% $265 84% 84% 22% $226 81% 75% $127 $164 76% 59% 81% 78% S&M 51% 53% 51% 79% 79% $68 76% $52 $29 $38 14% 13% 12% 12% G&A FY17 FY18 1HFY18 1HFY19 FY17 FY18 Q2FY19 FY17 FY18 1HFY18 1HFY19 (1) For the periods ending January 31, 2017 and 2018, and for the first half of the fiscal years ending January 31, 2018 and 2019. $ in millions.. (2) Please see Appendix for non-GAAP reconciliation. (3) As of July 31, 2018. 30
(1) Improving profitability and cash flows Non-GAAP operatingincome Cashflow OCF FCF $55 $9 11% $36 $38 3% 12% $27 (2%) (5%) 7% ($12) ($11) $11 8% (1%) 5% $0 ($5) 0% (18%) ($70) (13%) ($48) FY17 FY18 1HFY18 1HFY19 FY17 FY18 1HFY18 1HFY19 (1) Please see Appendix for non-GAAP reconciliation. 31
Investment highlights Market $25B Large & Driving Proven leadership market growing growth, management as world’s opportunity customer scale and team #1 base with profitability e-signature strong solution expansion opportunities 32
Appendix 33
GAAP to non-GAAPreconciliation Gross Profit (in$K) Year Ended January31, Six Months Ended July31, 2017 2018 2017 2018 GAAP GrossProfit 278,982 400,231 183,459 228,197 Add: Stock-based Compensation in Cost ofRevenue 2,211 1,887 958 30,410 Add: Amortization of Intangibles in Cost of Revenue 6,940 6,793 3,388 2,671 Non-GAAP GrossProfit 288,133 408,911 187,805 261,278 Gross Margin (GAAP) 73% 77% 77% 71% Gross Margin (non-GAAP) 76% 79% 79% 81% Subscription Gross Profit (in $K) Year Ended January31, Six Months Ended July31, 2017 2018 2017 2018 GAAP Subscription Revenue 348,563 484,581 224,400 306,659 Less: GAAP Subscription Cost of Revenue (73,363) (83,834) 39,333 55,495 GAAP Subscription GrossProfit 275,200 400,747 185,067 251,164 Add: SBC in Subscription Cost of Revenue 1,190 911 469 11,543 Add: Amortization in Subscription Cost of Revenue 6,940 6,793 3,388 2,671 Non-GAAP Subscription Gross Profit 283,330 408,451 188,924 265,378 Subscription Gross Margin (GAAP) 79% 83% 82% 82% Subscription Gross Margin (Non-GAAP) 81% 84% 84% 87% 34
GAAP to non-GAAPreconciliation Adjusted Operating Gain / (Loss) (in $K) Year Ended January31, Six Months Ended July31, 2017 2018 2017 2018 GAAP Operating Loss (115,817) (51,653) (33,045) (305,278) Add: Stock-based Compensation in Cost ofRevenue 2,211 1,887 958 30,410 Add: Amortization of Intangibles in Cost of Revenue 6,940 6,793 3,388 2,671 Add: Stock-based Compensation in OperatingExpenses 33,232 27,860 15,960 279,549 Add: Amortization of Intangibles in Operating Expenses 3,385 3,250 1,505 1,530 Non-GAAP Operating Gain (Loss) (70,049) (11,863) (11,234) 8,882 Operating Margin (GAAP) (30%) (10%) (14%) (95%) Operating Margin (non-GAAP) (18%) (2%) (5%) 3% Free Cash Flow (in $K) Year Ended January31, Six Months Ended July31, 2017 2018 2017 2018 Cash Flow Provided by (Used in) Operations Activities (4,790) 54,979 11,401 37,688 Less: Purchases of Property, Plant, and Equipment (43,330) (18,929) (11,089) (10,520) Free CashFlow (48,120) 36,050 312 27,168 Free Cash Flow Margin (13%) 7% 0% 8% 35
GAAP to non-GAAPreconciliation Sales & Marketing (in$K) Year Ended January31, Six Months Ended July31, 2017 2018 2017 2018 GAAP Sales & Marketing 240,787 277,930 133,634 294,864 Less: Stock-based Compensation in Sales &Marketing (11,187) (9,386) (5,588) (129,272) Less: Amortization of Intangibles in Sales & Marketing (3,385) (3,250) (1,505) (1,530) Non-GAAP Sales & Marketing 226,215 265,294 126,541 164,062 Sales & Marketing as % of Revenue (GAAP) 63% 54% 56% 91% Sales & Marketing as % of Revenue (non-GAAP) 59% 51% 53% 51% Research & Development (in$K) Year Ended January31, Six Months Ended July31, 2017 2018 2017 2018 GAAP Research &Development 89,652 92,428 46,475 104,643 Less: Stock-based Compensation in Research &Development (10,161) (4,896) (2,679) (54,627) Less: Amortization of Intangibles in Research & Development 0 0 0 0 Non-GAAP Research &Development 79,491 87,532 43,796 50,016 Research & Development as % of Revenue(GAAP) 24% 18% 19% 33% Research & Development as % of Revenue (non-GAAP) 21% 17% 18% 15% General & Administrative (in $K) Year Ended January31, Six Months Ended July31, 2017 2018 2017 2018 GAAP General &Administrative 64,360 81,526 36,395 133,968 Less: Stock-based Compensation in General &Administrative (11,884) (13,578) (7,693) (95,650) Less: Amortization of Intangibles in General & Administrative 0 0 0 0 Non-GAAP General &Administrative 52,476 67,948 28,702 38,318 General & Administrative as % of Revenue (GAAP) 17% 16% 16% 42% General & Administrative as % of Revenue (non-GAAP) 14% 13% 12% 12% 36
Computation ofBillings Computation of Billings (in $K) Twelve MonthsEnded Three MonthsEnded Six MonthsEnded January31, July 31, July 31, 2017 2018 2017 2018 2017 2018 Revenue 381,459 518,504 125,543 167,044 239,041 322,852 Add: Contract Liabilities and Refund Liability, End of Period 195,501 282,943 214,405 300,426 214,405 300,426 Less: Contract Liabilities and Refund Liability, Beginning of Period (137,031) (195,501) (208,882) (293,667) (195,501) (282,943) Add: Contract Assets and Unbilled Accounts Receivable, Beginning of Period 2,532 10,095 10,400 14,555 10,095 16,899 Less: Contract Assets and Unbilled Accounts Receivable, End of Period (10,095) (16,899) (11,381) (16,196) (11,381) (16,196) Billings 432,366 599,142 130,085 172,162 256,659 341,038 37